Analyze and visualize solar panel data by comparing amorphous and poly-crystalline solar panels.
Developed for the Engie challenge at HackUIowa with elements of GitHubOps, DevOps, and WebDev, this project investigates the differences between triple-junction amorphous and poly-crystalline solar panels. It informs users about the benefits of switching to solar energy.
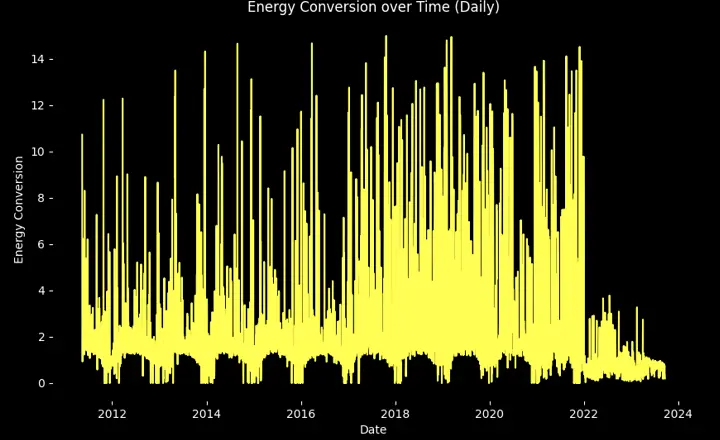
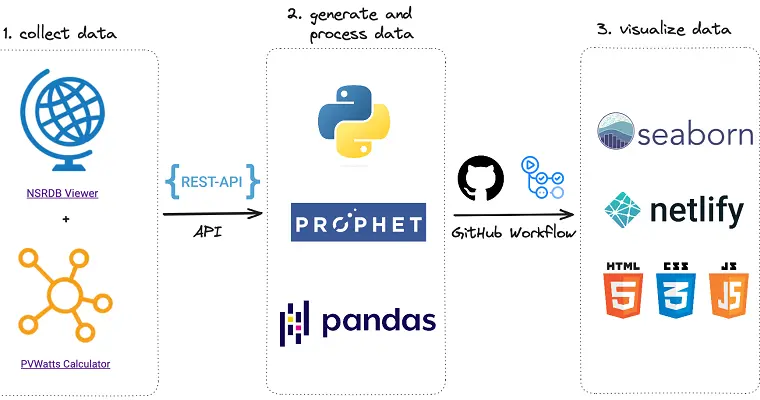
The project features a profit calculator, a comparison tool for the two types of solar panels, and visualizations of data from the University of Iowa's Electric Vehicle Charging Array over the last 12 years.
Key features include time-series prediction to fill data gaps, automatic data cleaning, and efficiency visualization.
Personal accomplishments include extensive use of the pandas library for data cleaning and restructuring, and handling 10 years of solar data.
- StackPython, HTML, CSS, JavaScript, Pandas, Prophet, Seaborn, GitHub, Netlify
- SourceGithub
- BlogDevpost
Awards
- Best Data VisualizationSponsored by Leepfrog